Calculating Sprint Velocity and Efficiency
Introduction
Are you using Agile to help your organization deliver products and/or services? If the answer to that question is yes, then you are breaking the work of bringing products and services to your customers into sprints. (If you are new to Agile and you do not know what a sprint is, I recommend Schwaber’s The Scrum Guide: The Definitive Guide to Scrum: The Rules of the Game.) A sprint in Agile is a time-boxed period.

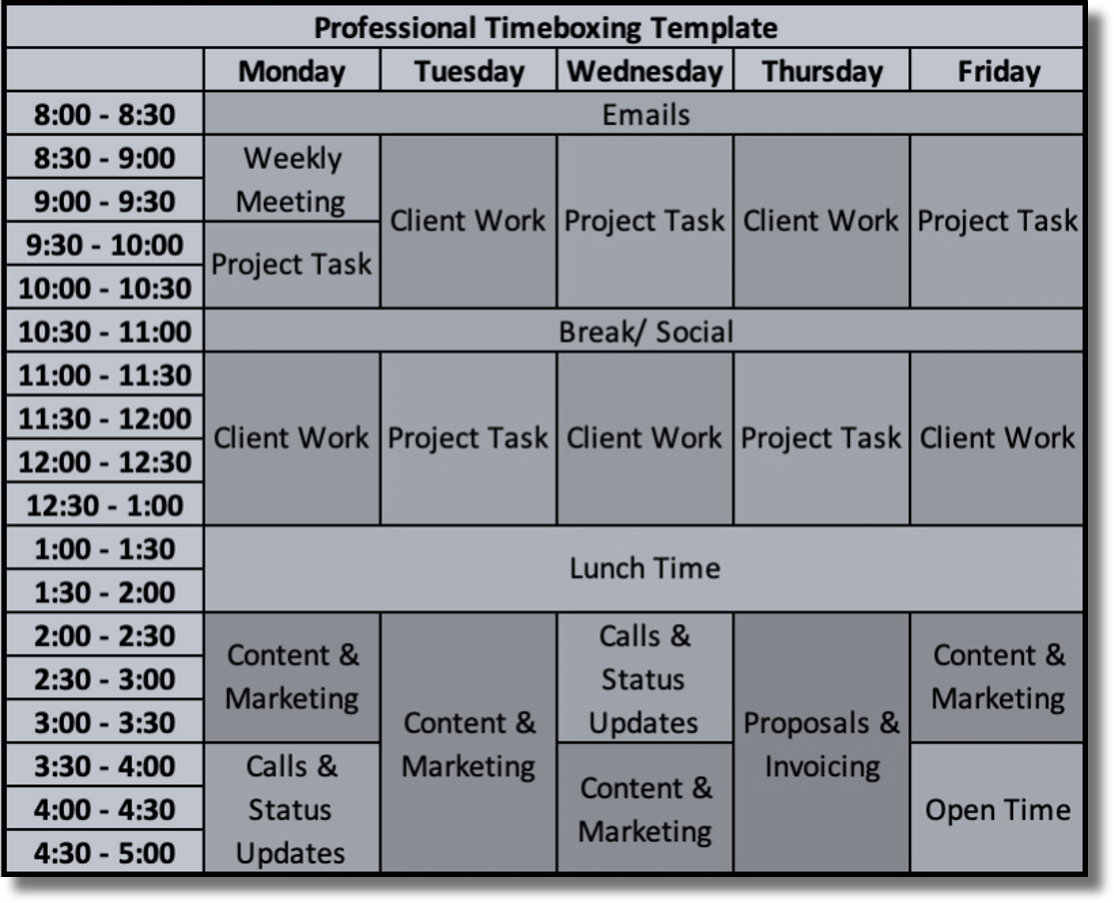
Figure 1 – A Sprint is a Time-Boxed Period for Agile Work. The figure shows time boxing outside of Agile for time at work.
That period ranges from one to four weeks. During the sprint period a specific set of work is attempted and made ready for review by a customer. The sprint is a fundamental unit in Scrum and the Agile framework.
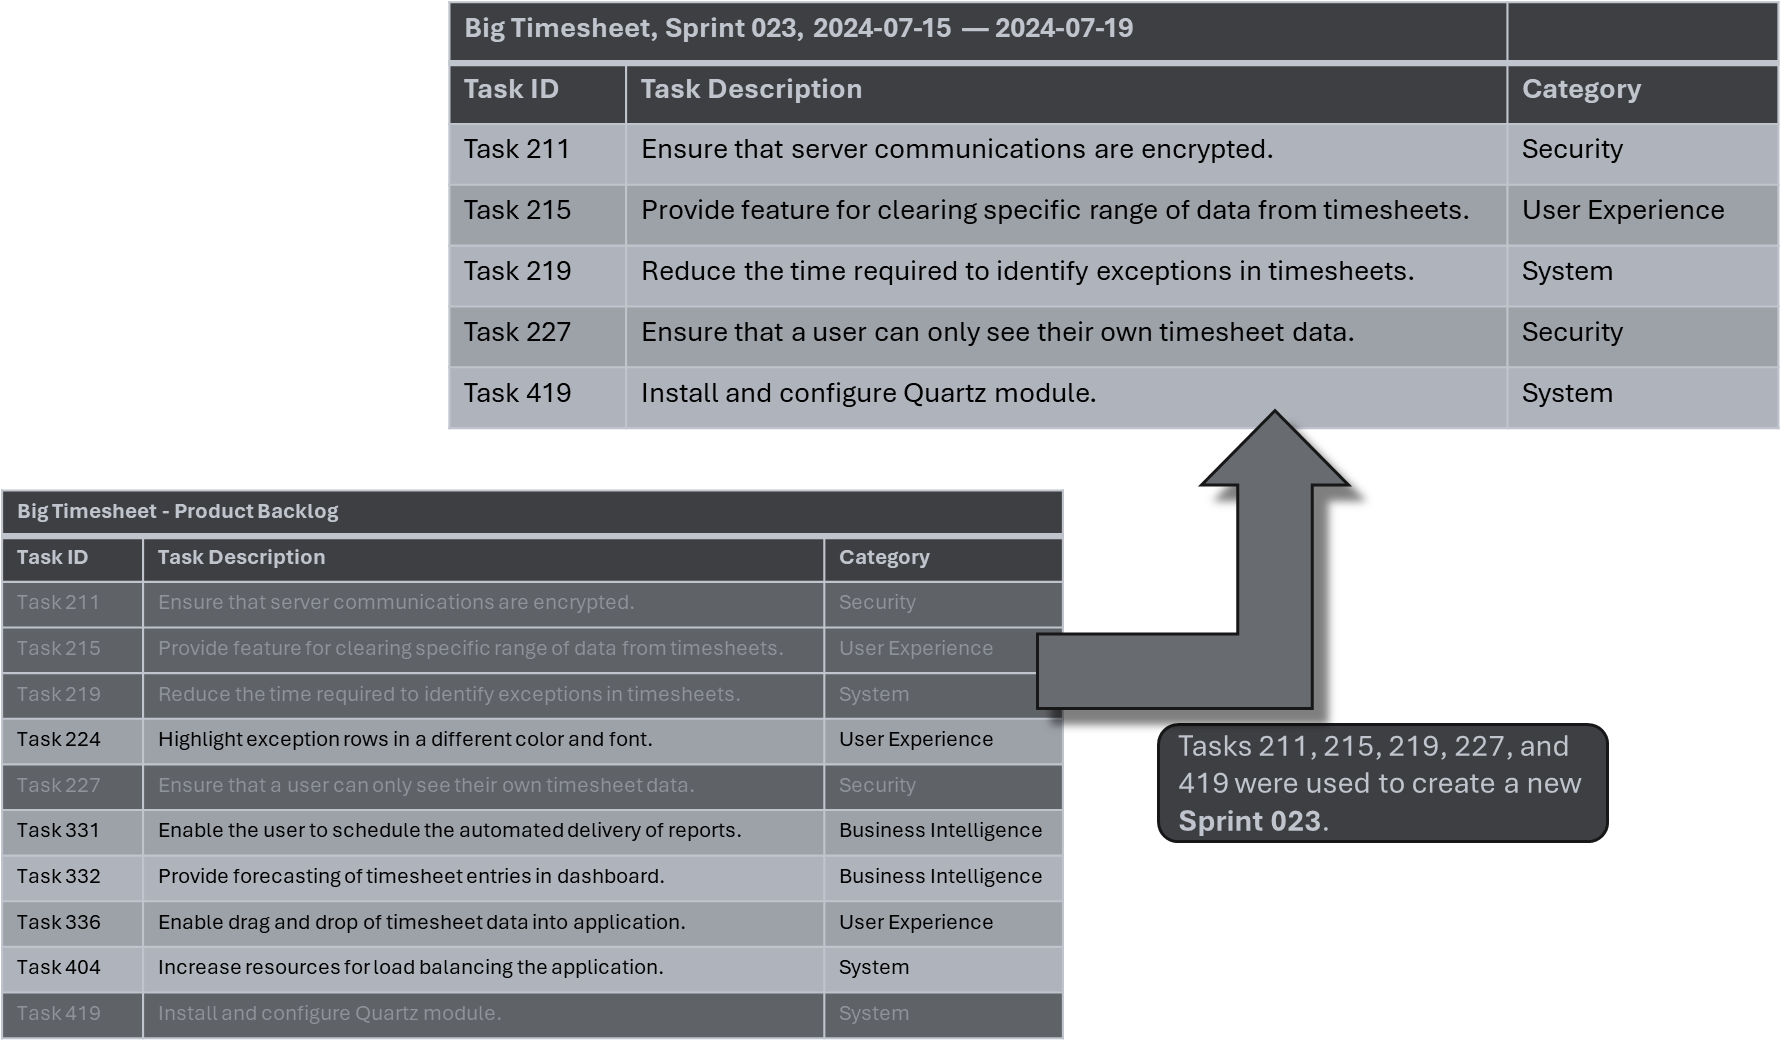
Your sprint is a single iteration in your product development or service delivery process. What happens during a sprint? It depends on whether your organization or team produces a product or a service. Let us say, for our discussion, that your team labors to deliver a viable version of a product. (A product could be a piece of software, alternators for a particular line of trucks, or a newsletter for a non-profit ministry). Your sprint begins with a planning meeting where the team defines the sprint goal and selects items from the product backlog to work on in the time-boxed period.

Figure 2 – Sprint tasks are selected from the backlog for completion in the time-boxed period.
Your sprint ends with a review and retrospective to assess the work completed and improve processes for the next sprint.
Getting better at sprints should be the ongoing goal of any organization that is leveraging Agile. To improve at sprinting there has to be business intelligence that tells the team how they did on the sprint. There have to be metrics and visuals that provide insight on (1) how things went down, (2) what went well, and (3) what could be done better.
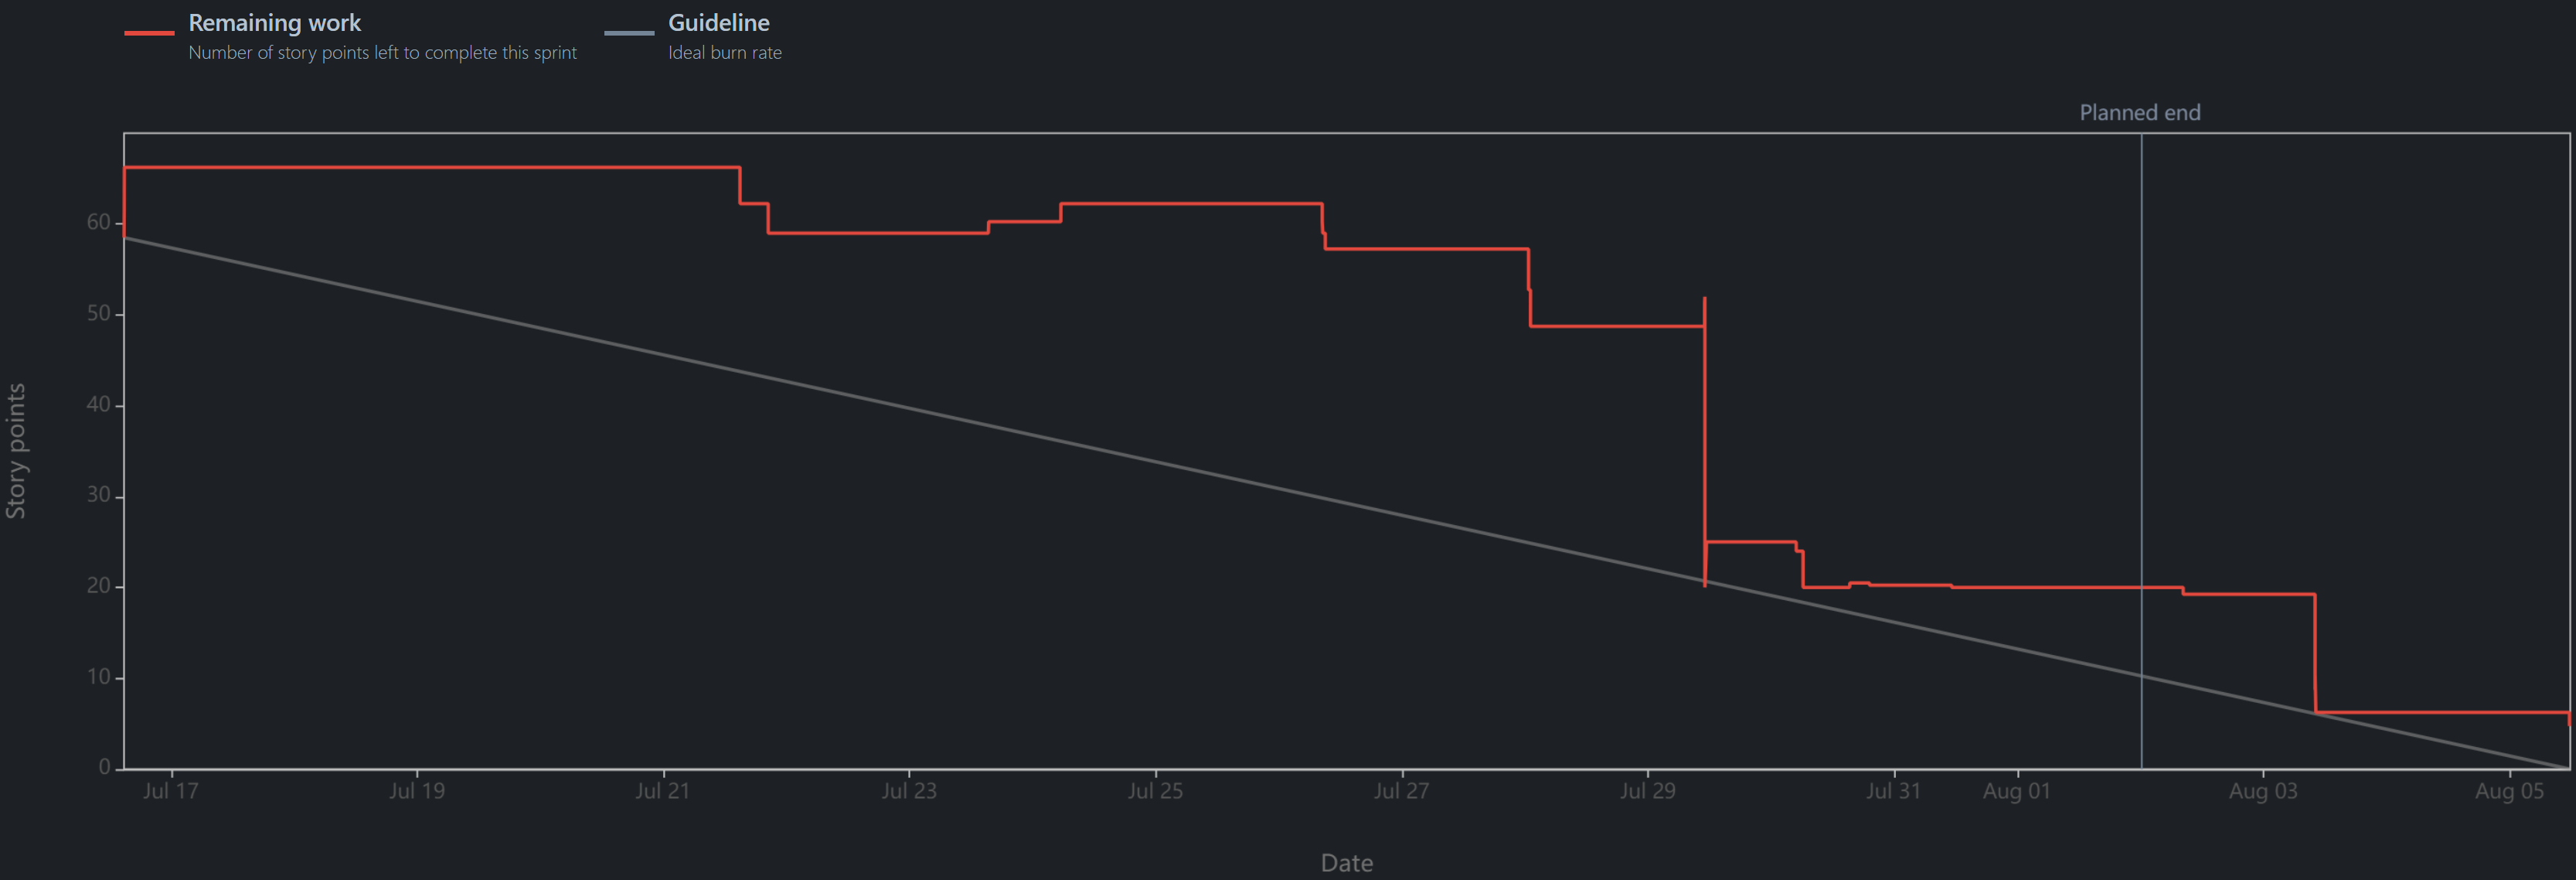
- Burndown Chart — A burndown chart in Agile is a visual tool that assists a team in tracking the progress of a project. It showings the amount of work remaining over time. The chart typically has time on the horizontal axis and work remaining (often in story points or hours) on the vertical axis.

Figure 3 – Example Sprint Burndown Chart
- Velocity — a tool that tracks the amount of work a team completes during a sprint. This metric usually is measured in story points or hours. It helps teams understand their progress, forecast future performance, and plan upcoming sprints more effectively by analyzing trends in completed work over time.
- Goal Success Rate — refers to the percentage of goals (or objectives) that a team successfully meets or achieves within a sprint. It measures how effectively a team delivers on its planned commitments. This metric helps to assess the team’s performance and ability to meet its targets.
Let us take on just one of these business intelligence components — velocity. Calculating velocity in Agile is important for several reasons:
- Predictability and Planning — Velocity calculations help teams estimate how much work they can complete in future sprints based on past performance. By knowing the average velocity, teams can make more accurate sprint plans, ensuring that they commit to a realistic amount of work. Velocity also helps with release planning. Using velocity a team is equipped to predict how many sprints are needed to complete a given set of features; this helps in release planning and setting realistic deadlines.
- Tracking Performance — By tracking velocity over multiple sprints, teams can monitor their performance. A consistent velocity (cruising) or improving velocity (acceleration) indicates a stable or improving team dynamic. Likewise, a declining velocity (deceleration) may signal overcommitment, burnout, or other inefficiencies that need to be addressed. Watching velocity for fluctuations can help in identifying bottlenecks or other emerging issues. Vigilance in this area can help a team leader to be proactive in preventing problems that will sink a project or cause serious delays.
- Transparency — Velocity provides an easy-to-understand metric that can be shared with stakeholders to communicate the team’s progress and capacity. This transparency builds trust and helps manage stakeholder expectations regarding timelines and deliverables. With good velocity data, stakeholders and teams can make informed decisions about scope adjustments, prioritization of work, or resource allocation to ensure that the project stays on track and aligned with business goals.
Using Jira to Calculate Velocity and Efficiency
Jira is a popular project management and issue tracking software packaged developed by Atlassian. It is widely used by Agile teams to manage their software development processes. Let us say that we have a software product called XSIPBI. Further, let us say that we are working through the development and release of features using sprints. In the table below we provide basic metrics for each sprint. The velocity in each sprint is the sum of story points for completed tasks.
| Sprint | Committed | Completed / Velocity | Goal Success Rate | Start Date | End Date | Duration Days | Efficiency ( pts / day ) |
| XSIPBI Sprint 011 | 20.8 | 3.8 | 18% | 2024-05-22 | 2024-06-04 | 10 | 0.380 |
| XSIPBI Sprint 012 | 27.5 | 22.4 | 81% | 2024-06-04 | 2024-06-27 | 18 | 1.244 |
| XSIPBI Sprint 013 | 28.8 | 16.5 | 57% | 2024-06-27 | 2024-07-16 | 14 | 1.179 |
| XSIPBI Sprint 014 | 60.5 | 45.5 | 75% | 2024-07-16 | 2024-08-05 | 15 | 3.033 |
| XSIPBI Sprint 015 | 4.8 | 12.5 | 260% | 2024-08-05 | 2024-08-13 | 7 | 1.786 |
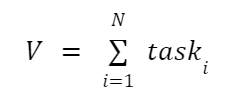
The formula for velocity, for those who like the notation of the Mathematics, is very simple and given in the equation below:

In this equation V is velocity and taski is the story points for the task with index i. While velocity is often touted as important, I find efficiency more informative as a metric of team performance in a sprint. Efficiency tells us the rate at which story points were being completed for each day of the sprint. The efficiency of a team is a ratio that makes it easy to compare the rate at which work was done across sprints. The sprint with the highest velocity in Table 1 is Sprint 014. More important than its velocity is the fact that it has the highest efficiency; three story points were completed every day… on average. The efficiency of Sprint 014 is higher than the efficiency of any of the other sprints in the table. Give a day to Sprint 012 and it will only finish 1.24 story points. Give the same amount of time to Sprint 014 and it will get more than twice the story points completed.
I regard sprint Efficiency like the MPG of a car. With a 2024 Ford Bronco Sasquatch (2.7L, 6-cyl, AWD) I can go 17 miles on a gallon of gas in city driving; in other words, it has a city MPG of 17. With a 2024 Ford Maverick (2.5L, 4-cyl) I can go 33 miles on a gallon of gas in city driving; it has city MPG of 33. Given a single gallon of gas, the 2024 Ford Maverick is more efficient. Of course this is an oversimplification of how car efficiency is measured. We should also consider things like towing capacity and the number of cylinders in the engine. Likewise, when measuring the efficiency of a sprint we should also take into account the number of people involved and other resources required for getting the work done.
Conclusion
If you will add velocity to your business intelligence review of a sprint you will be able to use history to do better planning. A story point commitment that is being considered should be evaluated in the light of past commitments and how much was actually completed – the velocity. Don’t commit to story points that history shows are a case of sandbagging or pipe dreaming; make realistic goals using the velocity history of your team. Also, it would be good to calculate the efficiency of each sprint. This ratio gives you the mean of story points your team completed each day. I regard this value as the true velocity and can use it to say whether or not our team can expect to finish all of the tasks before the end of the sprint. Using efficiency I am equipped to decide which task should get the attention if we know that not all of them can get done.
Side Note on Time-Boxing
Time-boxing refers to the project management practice of allocating a fixed amount of time to an activity, task, or event. Once the set time limit, or “time box,” is reached, the activity or task is stopped. What if the task or activity is not complete? It is still stopped. When time boxing of work is used to manage work, the task, activity, or event, regardless of whether it is completed, is brought to a halt. This concept is an often-used time management technique to ensure that work progresses efficiently and that time is used effectively.
Is it practical? Very! In a practical sense, time-boxing keeps teams on track by forcing them to acknowledge the scarcity of time. Teams or individuals using time boxing focus on specific tasks within a predetermined timeframe, avoiding scope creep and helping to prioritize work. For example, in a Scrum meeting, a “time-boxed” daily stand-up might be limited to 15 minutes. After 15 minutes the meeting ends. The meeting ends regardless of whether all topics have been discussed. This approach encourages concise communication and efficient use of time.
References
Schwaber, K., & Sutherland, J. (2020). The Scrum Guide: The Definitive Guide to Scrum: The Rules of the Game. Scrum.org. Retrieved from https://www.scrumguides.org/scrum-guide.html
Pressman, R. S., & Maxim, B. R. (2014). Software Engineering: A Practitioner’s Approach (8th ed.). McGraw-Hill Education.
Rubin, K. S. (2012). Essential Scrum: A Practical Guide to the Most Popular Agile Process. Addison-Wesley.